WInG Library
What is WInG?
 WInG(Web Applications for Interactive Graphics) is the group of applications to make interactive statistical graphics. Basic statistical graphcs such as scatter plot, histogram and boxplot can be generated as SVG format including interactive functions quickly.
The System requirements are follows:
- Windows98/Me/2000/XP
- Internet Explorer 6
- Adobe SVG Viewer 3.0
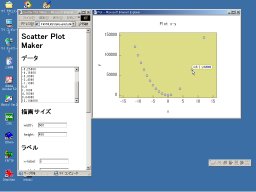
Scatter Plot Maker
Scatter Plot Maker generates the scatter plot including interactive functions. Data must be entered as follows.
x1,y1
x2,y2
x3,y3
....
....
After setting the canvas size, labels and colors, a scatter plot will be displayed when clicking "Draw Plot!" The data and settings can be changed as many times as needed. When saving the current plot, right-click the scatter plot and select "Save SVG As..".